
The Randomness of UUIDs: A Visual Analysis
// Published On: Jun 10, 2026

UUID is a widely used scheme of identifiers used wherever we need a reliable way of non colliding identifiers.
Quoting from Wikipedia:
For example, the number of random version-4 UUIDs which need to be generated in order to have a 50% probability of at least one collision is 2.71 quintillion, computed as follows
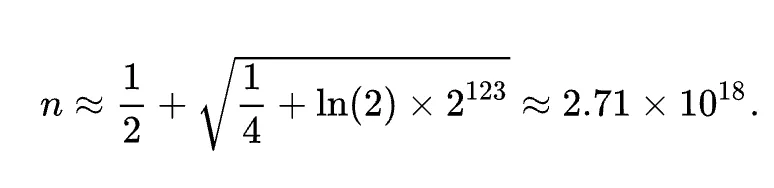
This number is equivalent to generating 1 billion UUIDs per second for about 86 years. A file containing this many UUIDs, at 16 bytes per UUID, would be about 45 exabytes.
The chances of them colliding are nearly 0 for all practical purposes.
Before I proceed any further, Let me show a bunch of UUID V4.
e496f045-abf4-430f-8d76-eba54507290e
90e46b0d-f896-4e85-85e9-51b8d12dfe09
1634b1ca-51c3-472d-bc5d-8e0422477bc1
607c45a7-a340-4389-a41c-f45378fc726c
22ca2835-58d8-47d8-9218-73a2a57bc264
3041cb8a-c526-4277-9c85-a93f31680a90
df5604eb-bd7b-480d-ac56-6179e8431526
Did you notice the following patterns?
- Each UUID is composed of 5 groups of hexadecimal numbers separated by a hyphen
- - Each group has 8, 4, 4, 4, 12 digits respectively.
- The third group always starts with
4. - The starting character of the 4th group will be always be
a,b,8, or9.
If we omit the - character from the UUID, you end up with a hexadecimal number with 32 digits.
Let us consider the following UUID:
df5604eb-bd7b-480d-ac56-6179e8431526Once I omit - it becomes:
df5604ebbd7b480dac566179e8431526and as I already mentioned, this is an hexadecimal number, which can be easily converted to a decimal integer number. In this case it is:
296864480396768545287063104547551647014Now that we established that UUID V4 identifier simply can be represented as a integer number, Have you ever wondered how these numbers are distributed if we generate a large number of them?
I have chosen to represent the data in a scatter plot, with the iteration number on the X-Axis and the UUID, expressed as an integer, on the Y-Axis.
I had to limit by the number of iteration to 20000 since the gruff library I used to plot the graph takes a long time to render the image if I use a value beyond that.
Enough talking ! show me the code
@x_values = []
@y_values = []
iteration_count = 20_000

iteration_count.times do |iteration|
  @x_values.push iteration
  @y_values.push SecureRandom.uuid.tr('-', '').to_i(16)
end

g = Gruff::Scatter.new
g.hide_line_markers = true
g.theme = {
  colors: %w[#ffffff #ffffff],
  font_color: 'white',
  background_colors: 'black'
}
g.data("UUID v4 distribution with #{iteration_count} entries", @x_values, @y_values)
g.write('uuid_distribution.png')
Check out the remarkable visual created by the script.
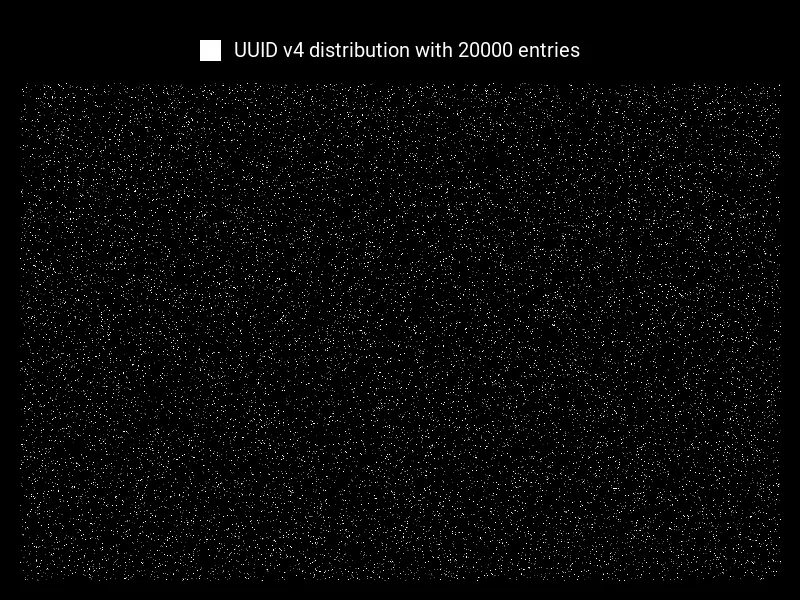
Each of the dot in this picture represents an UUID in the iteration, and it is very evident that the identifiers evenly distributed. The smallest id in this iteration is 0000b8d6-3faf-484e-8903-162d67c2e737 and the largest one is fffee0c0-c369-4a74-baa6-8135085b833a.
I hope I’ve captured your attention for a moment. Stay tuned for more interesting articles.